![]() Subtica Team
Subtica Team
16 min read
Customer Churn Rate Analysis for SaaS: How to Calculate Churn Rate, Perform a Churn Analysis, and Improve Retention
Customer churn rate analysis is one of the most important processes for any subscription-based SaaS business. If you lose customers faster than you acquire them, growth stalls, revenue declines, and customer lifetime value drops.
For subscription iOS apps, Subtica provides advanced App Analytics, Subscription Analytics, Revenue Analytics, Cohort Analysis, ARPU tracking, Revenue Forecasting, and Predictive Analytics to help teams calculate your customer churn rate, monitor monthly churn, and increase retention with data-driven decisions.

What Is Customer Churn and Churn Rate in SaaS?
Customer churn occurs when customers who stop using your product or service cancel their subscription. In SaaS companies, churn is higher when users fail to see value, experience friction, or switch to competitors.
Churn rate is one of the most important retention metrics because it directly affects monthly recurring revenue (MRR), customer lifetime value, and overall growth. A high churn rate means more revenue lost and more pressure on acquiring new customers just to maintain your customer base.
User churn can happen monthly or annually. Depending on your pricing model, churn rate varies by subscription type and depends on your industry.
What Is Customer Churn Rate?
Customer churn rate is the percentage of customers lost during a given period. It measures customer attrition rate and reflects the number of customers lost compared to the total number of customers at the start of the period.
There are two common timeframes:
- Monthly churn rate
- Annual churn rate
Monitoring churn helps you identify patterns in customer loss and understand the impact of churn on revenue.
Why Customer Churn Analysis Is Critical for Retention Analysis
Churn rate is essential because high churn reduces MRR, increases customer acquisition cost, and limits scalability.
When churn is higher, SaaS companies must acquire more new customers to offset customers lost. This increases pressure on sales and marketing budgets and reduces profitability.
Customer churn analysis helps you identify:
- Causes of churn
- Customer segment with higher churn
- Product usage gaps
- Revenue lost due to cancellations
- Customer experience issues
With Subtica's Cohort Analysis and Revenue Analytics, you can monitor overall churn, measure monthly churn rate, and detect early warning signals before a customer will churn.
Customer Churn vs Revenue Churn: Understanding Customer Churn and Revenue Churn
Customer churn tracks the number of customers lost.
Revenue churn tracks the revenue lost from cancellations or downgrades.
For subscription apps, revenue churn often provides deeper insight than pure customer attrition rate. If high-value clients cancel, the impact of churn is much greater.
Subtica's Subscription Analytics and Revenue Analytics allow you to compare customer churn and revenue churn in one dashboard and analyze the impact on monthly recurring revenue.
Types of Churn in Subscription Software
In a subscription software or SaaS business, churn is not a single metric. To perform accurate churn analysis and reduce churn effectively, you need to understand the different types of churn and how each one impacts customer retention, monthly recurring revenue (MRR), and overall growth.
Breaking churn down into categories helps you identify the real causes of churn, measure revenue lost correctly, and prioritize the right retention strategies.
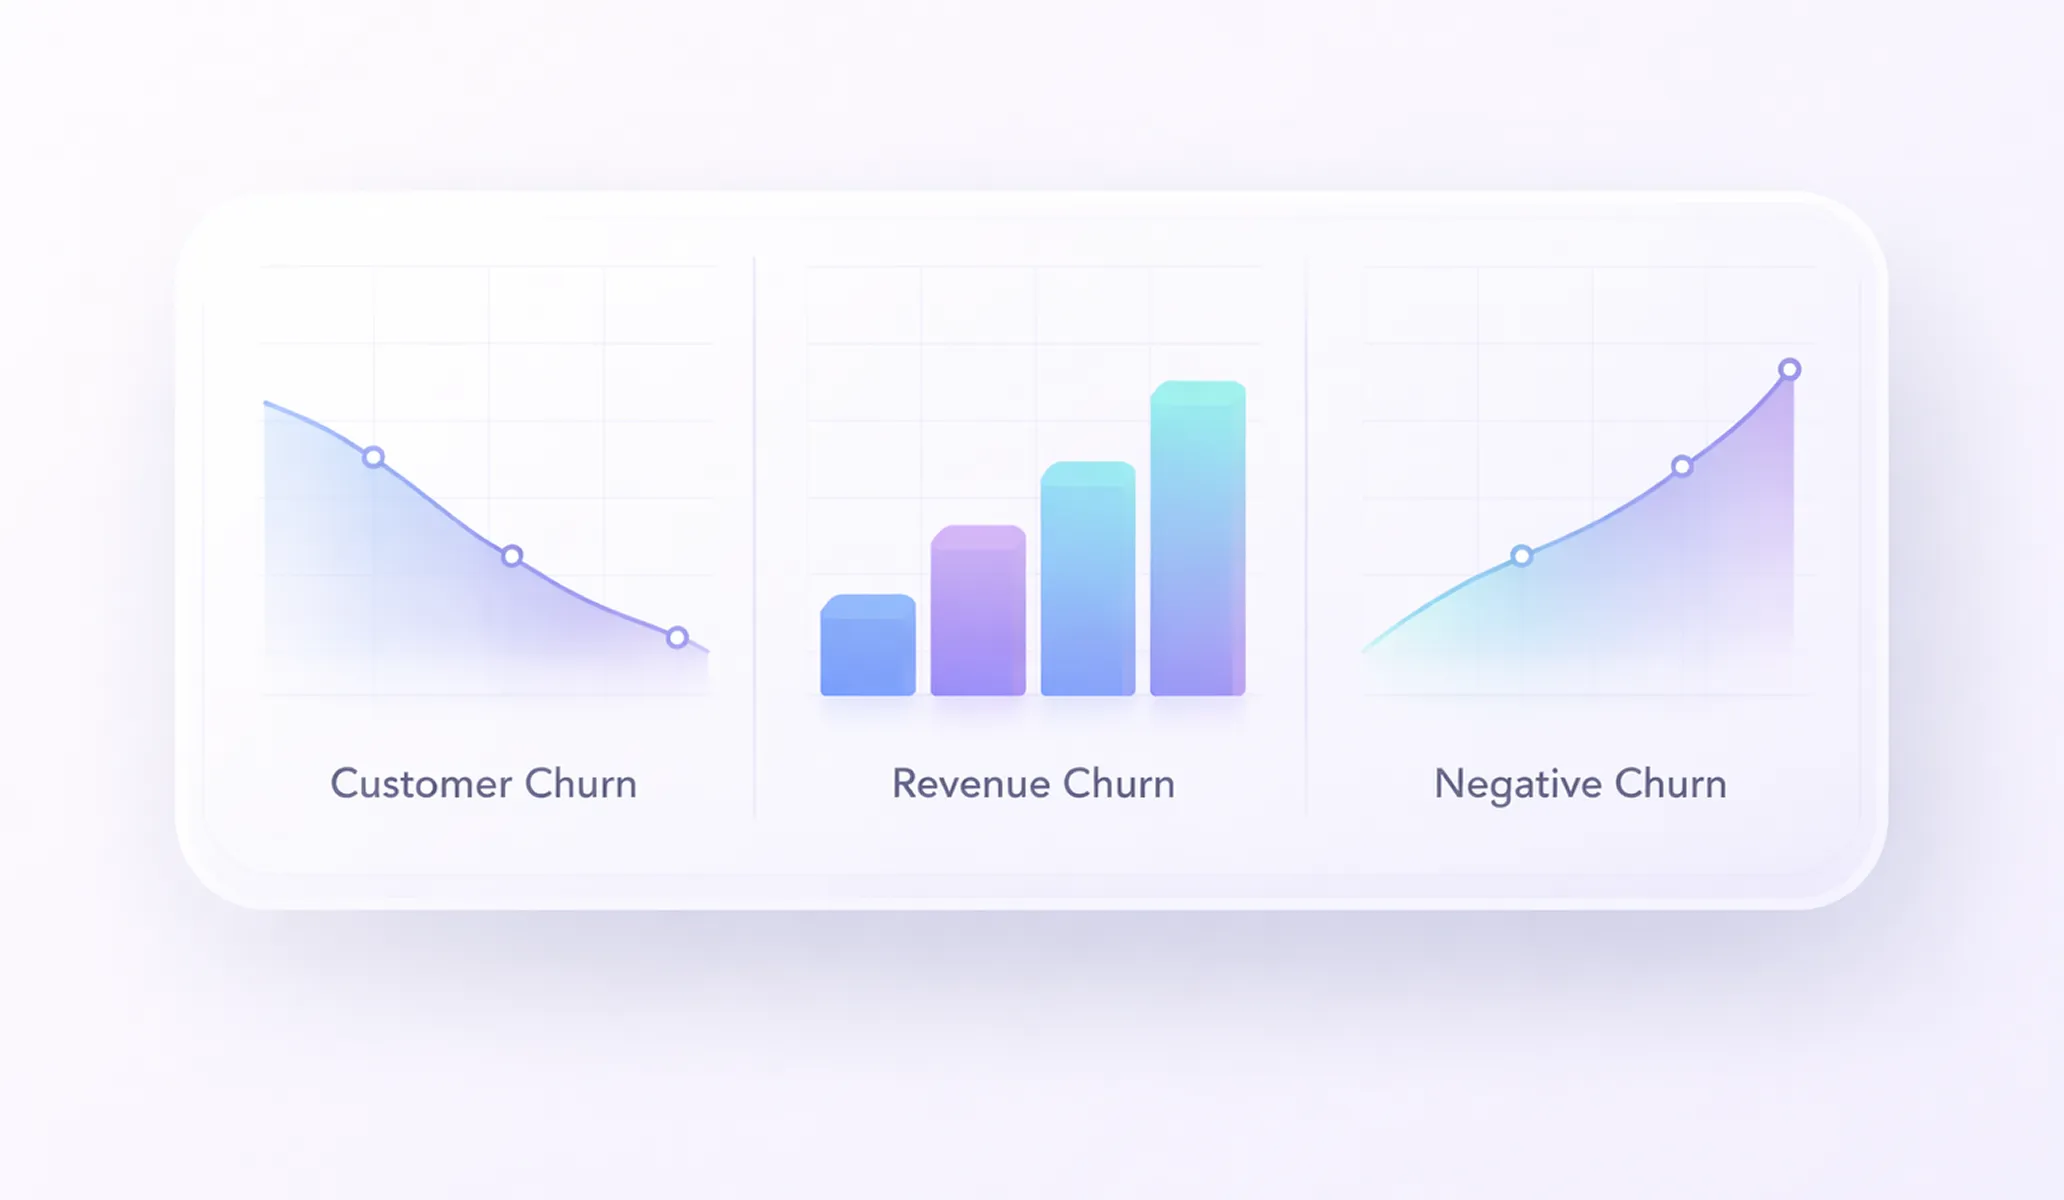
Customer Churn
Customer churn measures the number of customers who stop using your product or cancel their subscription during a specific period. It reflects user churn and overall customer loss volume.
This type of churn directly affects your customer base size. A high churn rate means you lose customers faster than you acquire new customers, which increases pressure on acquiring new customers just to maintain growth. Monitoring customer churn rate helps you identify which customer segment is most affected and whether churn is higher among new customers or existing customers.
Revenue Churn
Revenue churn measures MRR lost from customers canceling, downgrading plans, or reducing usage. Unlike customer churn, revenue churn focuses on the financial impact of churn rather than just the number of customers lost.
For SaaS companies, revenue churn is often more critical because losing a high-value client generates more revenue lost than several low-value users canceling. Tracking revenue churn alongside customer churn and revenue churn together provides a complete view of the impact of churn on monthly recurring revenue and customer lifetime value.
Negative Churn
Negative churn rate occurs when expansion revenue from existing customers exceeds the revenue lost from cancellations and downgrades. In this case, your SaaS business grows even if some customers are canceling.
Negative churn typically happens when ARPU increases due to upgrades, cross-sells, or pricing adjustments. This is a strong indicator of product-market fit and healthy customer retention. For subscription apps, increasing expansion revenue can offset customer attrition rate and stabilize overall churn.
Involuntary Churn
Involuntary churn occurs when customers are canceling unintentionally due to failed payments, expired credit cards, or billing errors. Customers may still value and be using your product or service but are removed from the system due to payment issues.
Monitoring this type of churn helps you identify operational gaps that cause unnecessary customer loss. Reducing involuntary churn can significantly improve customer retention without changing product features, customer experience, or pricing.
How to Calculate Churn Rate
To calculate churn rate, divide the number of customers lost during a specific period by the number of customers at the beginning of that period, then multiply by 100 to get your monthly churn rate or annual churn rate percentage.
Customer Churn Rate Formula
Customer churn rate =
(Number of customers lost during period ÷ Number of customers at start of period) × 100
If 50 customers are canceling out of 1,000 existing customers, your monthly churn rate is 5%.
Revenue Churn Rate Formula
Revenue churn rate =
(MRR lost during period ÷ MRR at start of period) × 100
How to Calculate Customer Churn Step-by-Step
- Define the time period (monthly or annual churn rate).
- Identify the number of customers at the beginning.
- Count the number of customers lost.
- Divide and multiply by 100.
Calculating your churn rate consistently allows accurate monitoring churn trends.
Example: How to Calculate Churn Rate for Subscription SaaS
If your SaaS business starts the month with 2,000 customers and 100 customers who stop using your product cancel, your monthly churn rate is 5%.
If those customers generated $20,000 in MRR, that represents direct revenue lost and long-term impact on customer lifetime value.
What Is a Good Churn Rate for SaaS and Subscription Apps?
A good churn rate depends on your industry, pricing, and growth stage.
Generally:
- B2C subscription apps often experience higher churn.
- B2B SaaS companies aim for low monthly churn (below 3–5%).
Churn rate varies depending on customer experience, product value, and market competition.
Using Subtica's Predictive Analytics, you can benchmark overall churn and learn more about churn drivers across customer segments.
What Is a Churn Analysis?
Customer churn analysis is the structured process of analyzing your churn data to understand reasons behind customer cancellations and customer loss.
It answers key questions:
- Why are customers canceling?
- Which customer segment has higher churn?
- When does churn occur?
- What is the impact of churn on MRR?
How to Perform a Customer Churn Analysis
To perform a customer churn analysis, start by calculating your customer churn rate and revenue churn for a defined period, then segment churn data by customer segment, pricing plan, acquisition channel, and product usage behavior. Analyze the reasons behind customer loss, identify patterns in customers who stop using your product, measure the impact of churn on MRR and customer lifetime value, and use predictive analytics to detect early signals that a customer will churn so you can reduce churn and improve customer retention proactively.
Goal of the Churn Analysis
The goal is to reduce churn, increase retention, and improve customer lifetime value.
Churn Data Required to Analyze Churn
- Number of customers
- Number of customers lost
- Monthly recurring revenue
- Product usage metrics
- ARPU (average revenue per user)
- Customer acquisition cost
Subtica centralizes all this data in one analytics platform for subscription iOS apps.
Step-by-Step: How to Analyze Churn Data
- Calculate your customer churn rate.
- Segment customers by behavior and subscription plan.
- Analyze product usage before churn occurs.
- Measure revenue lost and overall churn trends.
- Compare new customers vs existing customers retention.
Cohort-Based Customer Churn Analysis
Cohort Analysis helps you identify whether churn is higher for specific acquisition periods or pricing tiers.
Analyzing Your Churn by Customer Segmentation
Segment churn by:
- Plan type
- Acquisition channel
- Customer segment
- Engagement level
This helps you identify which client groups are at risk.
Analyzing Your Churn by Pricing and Plans
Price sensitivity often contributes to customer attrition rate. Subscription Analytics in Subtica shows how pricing impacts churn rate.
Output Format of a Customer Churn Analysis (Table Section)
A proper churn analysis output includes:
- Monthly churn rate
- Annual churn rate
- Revenue churn
- Negative churn rate
- Customer lifetime value
- ARPU
- MRR trend
How to Analyze Churn Rate Using Subscription Analytics
To analyze churn rate using subscription analytics, combine customer churn rate, revenue churn, MRR, ARPU, and cohort data into a single view to understand both the volume and financial impact of churn. Start by tracking monthly churn rate and overall churn trends, then segment churn by customer segment, pricing plan, acquisition source, and product usage behavior.
Using tools like Subscription Analytics, Revenue Analytics, and Cohort Analysis, you can identify when churn occurs, which customers are canceling, and whether churn is higher among new customers or existing customers. Advanced Predictive Analytics helps you detect early warning signs in customer health and engagement data, allowing you to reduce churn, increase retention, and protect monthly recurring revenue before significant revenue lost impacts your SaaS business.
Key Metrics Needed to Analyze Churn Rate
- Monthly churn
- Overall churn
- MRR
- ARPU
- Customer lifetime value
Customer Health and Customer Success Signals
Customer health scoring using product usage and engagement signals helps predict if a customer will churn.
Behavioral Patterns and Customer Health Scores
Subtica's App Analytics and Predictive Analytics detect early warning signs before customers stop using your product.
Identifying High-Risk Segments Before Churn
Predictive models help reduce churn by identifying users likely to churn based on engagement drop, payment behavior, and subscription lifecycle.
Need to Analyze Churn? Key Reports for Subscription Software (Table Section)
If you need to analyze churn effectively, you must rely on structured reports that connect customer churn, revenue churn, product usage, and retention trends in one place. Monitoring churn without segmentation or financial context makes it difficult to understand the real impact of churn on your SaaS business.
Below are the key reports every subscription software company should use to analyze churn and reduce customer loss:
| Report | What It Shows | Why It Matters |
|---|---|---|
| Customer Churn Rate Report | Monthly churn rate, annual churn rate, number of customers lost | Helps calculate your customer churn rate and track customer attrition rate trends |
| Revenue Churn Report | MRR lost, revenue lost from downgrades and cancellations | Measures the financial impact of churn on monthly recurring revenue |
| Cohort Retention Report | Retention by acquisition month or customer segment | Helps you identify whether churn is higher for specific cohorts |
| ARPU & Expansion Report | Average revenue per user and upgrade trends | Detects negative churn rate and expansion from existing customers |
| Customer Health Report | Product usage, engagement signals, predictive risk scoring | Helps identify which customer will churn before customers are canceling |
| Segment-Based Churn Analysis | Churn by plan, pricing tier, acquisition channel | Reveals reasons behind customer loss and high churn rate patterns |
Using Subscription Analytics, Revenue Analytics, Cohort Analysis, ARPU tracking, and Predictive Analytics, Subtica centralizes these reports into a unified dashboard. This allows SaaS companies to monitor overall churn, understand the causes of churn, and take proactive steps to reduce churn, increase retention, and protect their customer base.
How to Reduce Customer Churn and Improve Retention
Reducing churn and improving customer retention requires more than reacting to customers who are canceling. You need a proactive strategy based on churn analysis, customer health monitoring, and continuous optimization of the customer experience. When you understand why churn occurs and which customer segment is most at risk, you can reduce churn before revenue lost impacts your SaaS business.
Align Customer Success Around Customer Health
Customer success teams should focus on measurable customer health indicators such as product usage, engagement frequency, subscription status, and support activity. Strong customer support and proactive engagement improve customer experience and increase retention.
By monitoring customer health signals, you can detect when a customer will churn and intervene before customers who stop using your product officially cancel. This approach reduces customer attrition rate and stabilizes your customer base.
Optimize Onboarding to Reduce Early Churn
Most churn occurs early when new customers are not fully using your product or service or fail to see immediate value. High churn rate during the first weeks often indicates onboarding friction.
Tracking product usage during the early lifecycle helps you identify activation gaps. Improving onboarding flows, education, and value communication reduces early user churn and lowers monthly churn rate.
Improve Retention With Data-Driven Customer Success
Retention improves when decisions are based on churn data instead of assumptions. By analyzing product usage trends, engagement drops, and behavioral signals, you can identify the causes of churn and prioritize the right actions.
Data-driven customer success strategies help you increase retention, improve customer lifetime value, and reduce the number of customers lost over time.
Use Churn Analysis to Predict and Prevent Revenue Churn
Revenue churn directly impacts monthly recurring revenue (MRR) and long-term growth. Using churn analysis combined with Revenue Forecasting and Predictive Analytics allows you to model the impact of churn before it happens.
Subtica's Revenue Forecasting and Predictive Analytics help you forecast future revenue, monitor monthly churn rate, and identify high-risk clients based on engagement patterns. This predictive approach enables you to reduce churn proactively rather than reacting after customer loss occurs.
Reducing churn improves MRR, lowers customer acquisition cost, and makes acquiring new customers more efficient. Instead of constantly replacing customers lost, your SaaS business can focus on sustainable growth and stronger customer retention.
When Should You Calculate Churn Rate?
You should calculate churn rate on a monthly basis and review annual churn rate for strategic planning.
Monitoring churn continuously helps SaaS companies detect patterns in customers who stop using your product and adapt retention strategies accordingly.
Common Mistakes When You Analyze Churn
- Ignoring revenue churn
- Not segmenting churn data
- Focusing only on bringing in new customers
- Underestimating customer experience
- Failing to monitor monthly churn rate
Customer Churn Analysis for Subscription iOS Apps
Subscription iOS apps often experience higher churn due to low switching costs.
Subtica provides:
- App Analytics to track product usage
- Subscription Analytics to monitor churn rate
- Revenue Analytics to measure MRR and revenue lost
- Cohort Analysis to compare retention by segment
- ARPU tracking to measure average revenue per user
- Predictive Analytics to forecast churn
With advanced monitoring churn dashboards, Subtica helps you reduce churn, improve customer retention, and scale your SaaS business sustainably.
FAQ
Want to Apply These Insights to Your App?
Track subscription metrics, reduce churn, and scale your iOS app revenue with Subtica’s subscription analytics platform.


Related Articles

Subscription Analytics Dashboard for SaaS: Data-Driven Metrics and Revenue Insights for iOS Apps
Subscription analytics helps SaaS and subscription businesses turn data into valuable insight. Learn how subscription analytics software tracks subscription metrics, payments, and performance with customizable dashboards, charts, and one-click reports.
Subtica Team

Subscription Business Metrics to Track: Essential SaaS Metrics for Every Subscription Business
Discover the key subscription metrics every business should monitor. Learn which key metrics SaaS companies and subscription businesses use, the most important metric to track, and how a strong analytics system helps monitor subscription metrics and growth.
Subtica Team

Predictive Analytics Examples, Applications, and Algorithms for Subscription Apps
Predictive analytics helps businesses forecast trends using algorithms and data models. Learn how predictive analytics works, key use cases like fraud detection, and how companies use predictive analytics to forecast future outcomes.
Subtica Team

Predictive Analytics Definition: What Is Predictive Analytics and How It Works
Predictive analytics uses machine learning, data mining, and statistical models to predict future outcomes. Learn the predictive analytics definition and how businesses use predictive analytics with historical data and current data to forecast trends.
Subtica Team

ARR Revenue: Annual Recurring Revenue Calculation, Recurring Revenues & How to Calculate ARR for SaaS Business Billing
ARR revenue (annual recurring revenue) is a core metric for subscription and SaaS business models. In this guide to annual recurring revenue, learn how to calculate ARR, understand recurring revenues, and improve revenue growth. Discover ARR calculation methods, why this SaaS metric matters, and how annual recurring revenue supports predictable subscription business performance.
Subtica Team

MRR (Monthly Recurring Revenue): How to Calculate MRR and Use MRR to Grow Your Subscription Business
Learn the meaning of MRR (monthly recurring revenue), how to calculate MRR using the MRR formula, and why MRR is important for SaaS companies. Discover how this important metric impacts cash flow per month, subscription business growth, and long-term performance for SaaS companies.
Subtica Team

Mobile App Performance Metrics: Top Metrics, Key KPIs & App Analytics for Mobile App Performance
Discover the most important mobile app metrics to track app performance, user engagement, and engagement and retention. Learn how mobile app analytics metrics, KPIs, and app analytics tools help optimize mobile app performance and drive growth.
Subtica Team

Revenue Management Software: Best Revenue Management Software to Streamline Revenue and Simplify Revenue Management
Learn how revenue management software and modern RMS platforms help subscription apps automate revenue operations, improve forecasting accuracy, and optimize recurring revenue with analytics and AI.
Subtica Team

Mobile App Analytics: How Mobile Analytics Helps Optimize Mobile Apps
Understand how mobile app analytics works, which KPIs to track, and how analytics tools help optimize app performance, user engagement, retention, and subscription revenue.
Subtica Team